- Our Story
- Our Impact
-
Our Projects

Residential
Commercial

- Careers
 Enquire
 Call
Call
 chat
chat
 Search
Insight Brief - Re-Thinking Urban Heat Islands: High Density yet Cooler Urban Development
By Akhil Singhal, Tarun Garg - RMI India Foundation, Aun Abdullah - Lodha
April 28, 2025Acknowledgment: Mrinal Shrivastava – RMI
Urban Heat Islands – A Growing Concern in Indian Cities
Urban heat islands (UHI) occur when urban areas become significantly warmer than their rural surroundings due to human activities and built surfaces. This effect is increasingly evident in India’s rapidly growing cities, with studies reporting urban–rural temperature differences typically in the range of 2–10°C (Islam, Karipot, et al. 2024; Yadav and Singh 2024). In extreme cases, Indian megacities have seen UHI intensities soaring up to around 8 °C above nearby rural baselines (Yadav & Singh, 2024). In New Delhi, summer temperatures have been observed to be 7–10°C higher, and on calm nights, differences can reach up to 12°C (TERI, 2017). Such excess heat exacerbates thermal discomfort, drives up energy use for cooling, and worsens air pollution (Islam, et al. 2024).
More alarmingly, UHI amplifies the impact of heat waves – research has found that heatwave conditions “dominate” urban regions in India due to the compounding effects of UHI, high anthropogenic heat release, and climate change (Kishore, et al., 2022). This makes densely built and improperly designed city neighbourhoods dangerously hot during summer extremes, posing serious public health and other systemic risks. For instance, even a 0.6°C rise in temperature can push electricity demand up by 2%, driven by increased use of air conditioning (TERI, 2017)—further fueling emissions and climate change. The need to mitigate UHI effects in India’s cities is therefore urgent, as emphasized by recent reviews calling for prompt measures and heat-aware urban planning (Yadav & Singh, 2024). Despite its growing impact, UHI remains under-studied and under-addressed in India (Sharma, Pradhan, Kumari, & Bhattacharya, 2021).
Using Land Surface Temperature (LST) to indicate Urban Heat Islands
As Indian cities expand rapidly in the era of urbanization, there is an urgent need to accelerate case-based research and integrate UHI mitigation into urban planning to ensure livable, climate-resilient futures.
Land Surface Temperature (LST) provides a valuable metric for assessing UHI intensity using remote sensing. LST is essentially a measure of how hot the Earth’s surface would feel to touch at a particular location (NASA Earth Observatory, n.d.). In 2016, LST was also listed as one of the essential climate variables (ECVs) by the Global Climate Observation System of the World Meteorological Organization (Global Climate Observing System, n.d.).
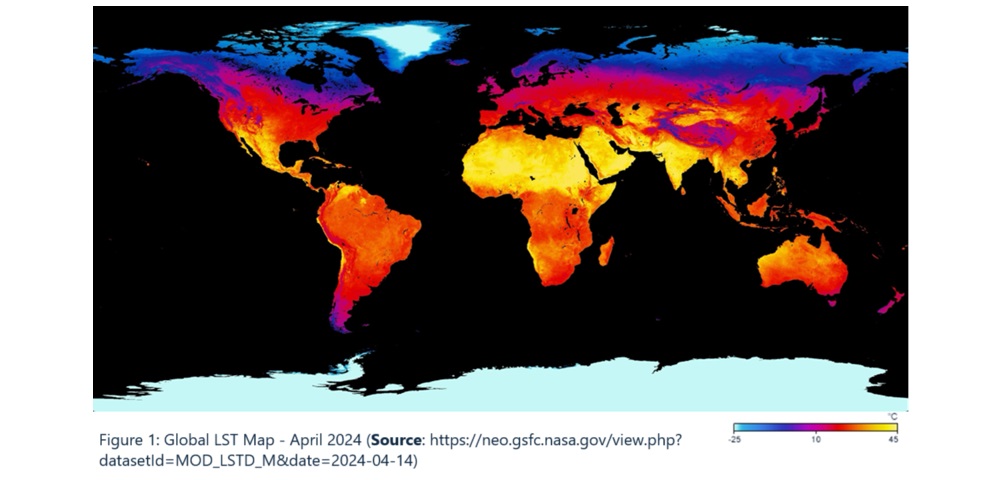
LST differs from the ambient air temperature (reported by weather stations) because land surfaces (concrete, asphalt, roofs, soil) heat up and cool down faster than the air. Thermal infrared sensors on satellites like NASA’s Landsat 8/9 and MODIS can be used to estimate LST
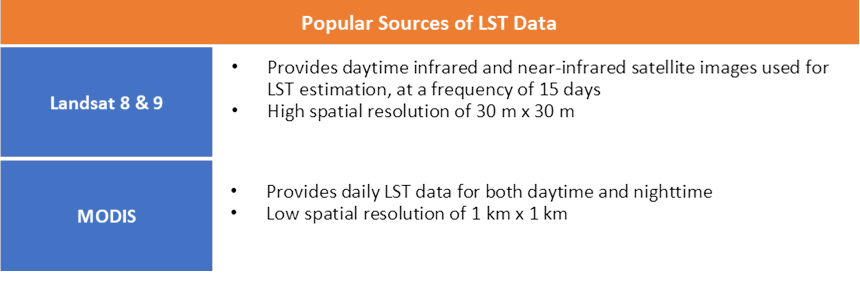
across settlements, enabling UHI “heat maps” to be created. Landsat, for example, offers ~30 m X 30m resolution thermal images every 15 days, reasonably sufficient to identify neighbourhood-level hot spots with uniformity in urban character at the intra-cluster level (though not highly precise for deep dives on materials and intra building variations).
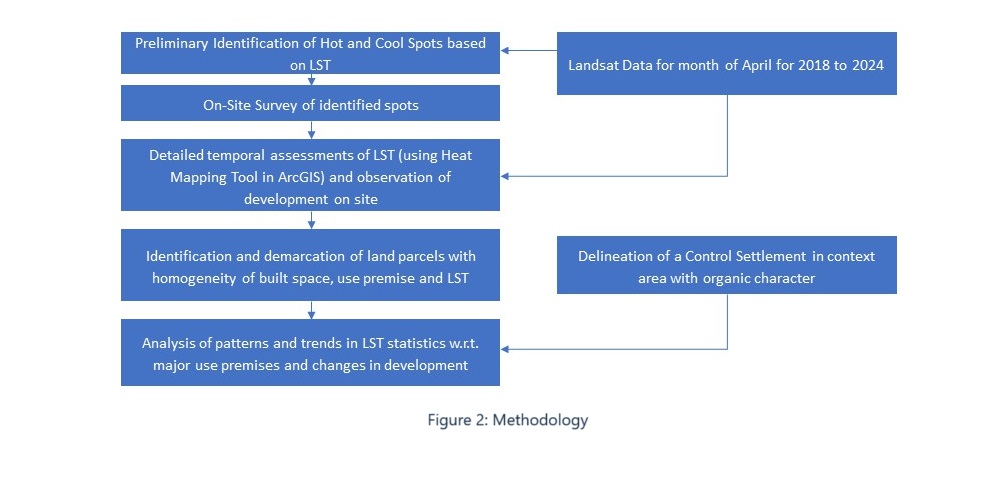
By analysing LST data, one can visualize the spatial pattern of urban heat – highlighting pockets of high surface temperature (UHI hot-spots) often corresponding to dense built-up or sparsely vegetated areas (ARSET, 2022). In this study, multi-year satellite LST analysis (derived from Landsat imagery for April of 2018 through April 2024) was used to evaluate the progression of UHI in a planned township, Palava City Phase 2, compared to an adjacent traditional settlement, Khoni Pagadyacha Pada (hereinafter referred to as Khoni).
April represents the hot-dry season in western India, when dry heat is high, and moisture is low – ideal conditions to observe peak UHI effects at a neighbourhood level. This also corresponds to a period of low to no cloud cover – enabling better estimations using Landsat.
Insights: Palava Phase 2 vs. Khoni: Planning for a Cooler Settlement
Palava City Phase 2 (near Mumbai and closer to Kalyan-Dombivali, India) is a planned township prioritizing sustainability and liveability. Launched in the late 2010s, Palava’s design explicitly aimed to integrate green spaces, water bodies, reflective building materials, and a climate-sensitive layout. A satellite-based LST assessment from 2018 to 2024 offers insight into how these strategies influenced the area’s thermal profile as the settlement developed. A nearby organic settlement, Khoni, was analysed in parallel as a “control” – representing an unplanned, traditional built-form and an organic layout with predominantly low-rise structures, unregulated materials, limited vegetation and open spaces as well as limited infrastructure interventions.
In this study, multi-year satellite LST analysis (derived from Landsat imagery for April of 2018 through April 2024) was used to evaluate the progression of UHI in a planned township, Palava City Phase 2, compared to an adjacent traditional settlement, Khoni Pagadyacha Pada (hereinafter referred to as Khoni). April represents the warm-dry season in western India, when dry heat is high, and moisture is low – ideal conditions to observe peak UHI effects at a neighbourhood level. This also corresponds to a period of low to no cloud cover – enabling better estimations using Landsat.
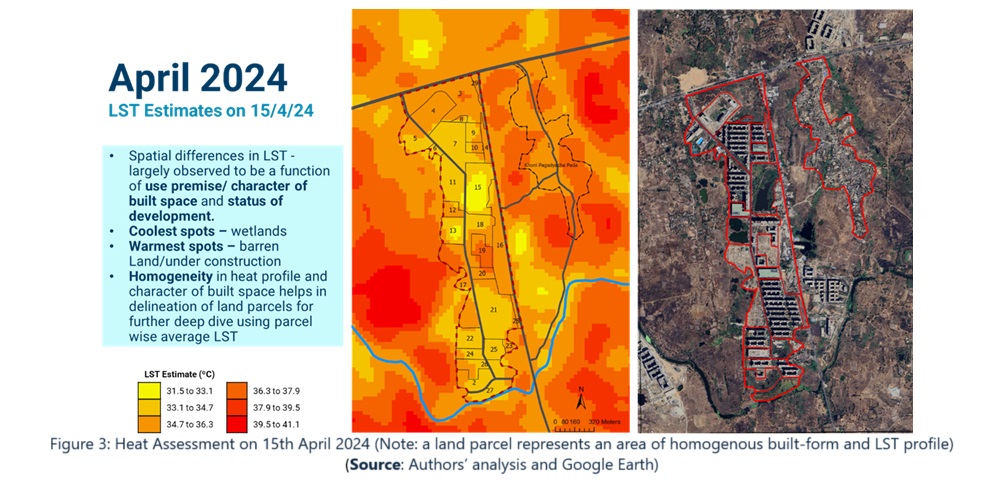
Development Trajectory: In the 2018 LST maps, Palava Phase 2 was still in early stages of development. Large tracts of exposed soil and ongoing construction (with sparse vegetation) registered as heat spots, often exceeding 45 °C in daytime surface temperature. Such barren or under vegetated lands tend to absorb sunlight readily and radiate heat, leading to higher LST. Further, the area is dotted with basaltic rock outcrops which get heated up rapidly on sun exposure.
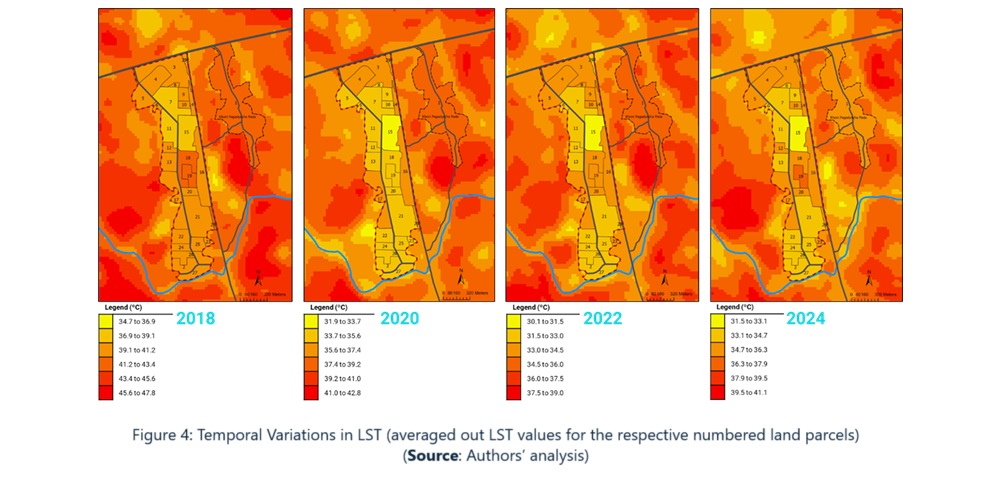
The LST maps show the areas with existing tree cover or water (e.g. wetland patches in land parcels 13 and 15) showed significantly cooler surface temperatures, close to 4-5°C lower than the hottest spots – consistent with well-established cooling effects of moisture and vegetation.
As Palava’s development progressed through 2020 and 2022, many of the initial hot spots were converted into buildings and planned open spaces. The LST analysis shows a clear, relative cooling trend in these areas by 2024, once landscaping and tree plantation had matured (particularly, parcels 2 and 27 for open spaces, and parcels 21, 22 and 26 for group housing clusters). Planned open spaces that were initially barren (and thus hot) saw a reduction of around 3°C in LST, post landscaping – aligning with studies in other cities where introducing urban greenery led to surface cooling of 1–3°C (Marando, et al., 2021).
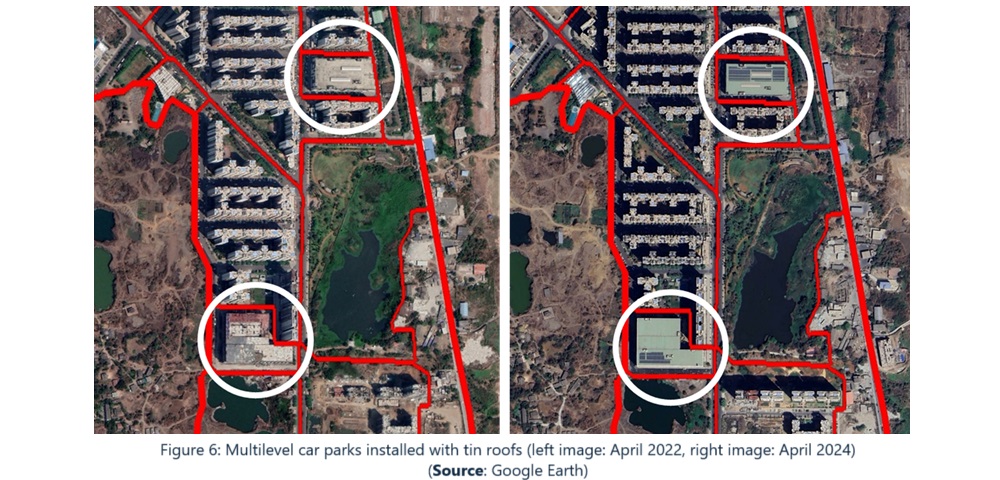
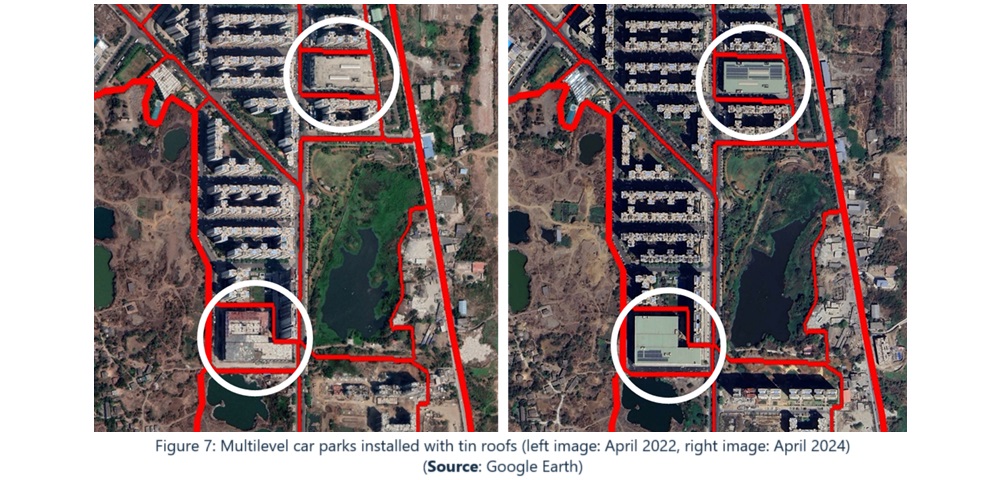
On the other hand, certain newly built structures slightly increased local LST: for instance, the addition f expansive metallic rooftops (e.g. tin sheet roofs over parking structures added between 2022 and 2024) raised the LST of those specific blocks by 2 to 3 °C relative to adjacent high-rise residential blocks as depicted in LST assessment.
Overall, Palava’s LST in 2024 was more homogeneous across the various land parcels, compared to its 2018 state (observed delta of 3.6°C in 2024 as compared to 5.84°C in 2018, delta represents the difference between the LST values of the parcels showing minimum and maximum LST respectively in the particular year of assessment) – an indication that the UHI intensity was lowered as the city implemented cooling design features and generally as the township developed to take its final shape as per the plan.
Planned vs. Organic Outcomes: Throughout the 2018–2024 period, the control settlement (Khoni) consistently exhibited higher surface temperatures than the parcels inside Palava, largely under similar external climatic conditions. In 2024, for example, daytime land surface temperatures in Khoni averaged about 1.5–2°C above those in the fully developed parts of Palava. Field observation notes, remote assessment of built forms and LST data attribute Khoni’s extra warmth to its built-form and materials: the village’s organic layout has dense clusters of low-rise houses with dark concrete or corrugated metal roofs, narrow lanes with limited airflow, and relatively sparse vegetation cover. These factors cause greater heat accumulation – dark roofs and asphalt absorb solar radiation, and the lack of shade trees or wind corridors reduces cooling, resulting in a stronger heat island effect.
By contrast, Palava’s planned neighbourhoods, even when built-up, maintained lower surface temperatures, which can be accredited to its purposeful design. This real-world comparison echoes broader findings that organic settlements tend to suffer higher UHI intensity when green cover and reflective surfaces are lacking (Lodha, 2025). In other words, urban planning and design makes a measurable difference: Palava’s integrated approach achieved a locally cooler microclimate relative to the adjacently located organically evolved settlement.
Designing Urban Developments to Mitigate UHI
Palava Phase 2 offers a useful model of design strategies that can mitigate the UHI effect. Key features that contributed to a cooler urban environment include:
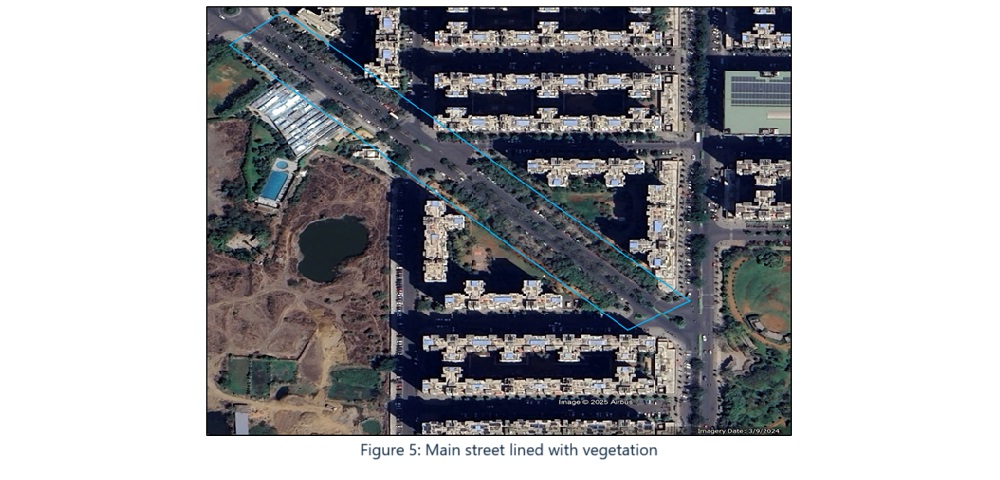
- Green Cover: The cityscape was infused with trees, gardens and parks from the start. By 2024, Palava Phase 2 had newly planted trees creating canopy over streets and open areas. This greenery provides shade and promotes evaporative cooling, which significantly lowers land surface temperatures. In European cities, for instance, a ~16% tree cover is found to reduce urban temperatures by about 1 °C (Marando, et al., 2021). In Palava, areas under tree shade or near water bodies were observably cooler than surroundings, validating the impact of “blue-green infrastructure” on urban microclimate.
- Reflective Surfaces: Palava’s buildings and street design elements make use of light coloured and reflective materials such as high Solar Reflective Index (SRI) paints on wall façade, light coloured pavements and using China mosaic on the rooftops. These surfaces reflect off a larger fraction of solar radiation instead of absorbing it, thereby heating up much less. Making surfaces light coloured is a well-known UHI mitigation strategy. Studies suggest that systematically using light-coloured urban surfaces could lead to lowering ambient temperatures by 2–3 °C in many cities (Pearce, 2018). Palava put this into practice at scale, lowering the heat build-up within the township clusters.
- Heat-Sensitive Layout: The master plan of Palava Phase 2 was designed to enhance natural ventilation and shading. Taller apartment towers are interspersed with open courtyards aligned to cast mutual shadows during the hottest time of the day. This urban geometry moderates the microclimate by allowing heat to dissipate and by providing shaded cooler pockets. In essence, the city’s form itself acts as a passive cooling system – a stark contrast to organic settlements where unorganised growth can block wind flow, often leading to heat buildup.
Implications for India’s Urban Future
The Palava Phase 2 case study demonstrates that proactive planning (at least at smaller scales and layout planning level) can lead to microclimatic heat mitigation and significantly curb the UHI effect. Contrary to the common narrative that dense urban areas worsen the UHI effect, this case shows that high net residential density can still have a cooling effect—if heat-sensitive design elements are well integrated into the built environment. Even as climate change pushes global temperatures upward, smart design interventions at the city and neighbourhood level can keep local urban environments cooler and more comfortable. This has direct benefits for public health (fewer heat-related illnesses), energy consumption (lower demand for air conditioning), and overall liveability in cities.
As India embarks on a path of urbanisation, integrating UHI mitigation from the outset will be crucial for cities to tackle extreme heat conditions. Measures such as suitable material selection and design strategies for the built-environment must become standard practice in urban planning guidelines.
References
ARSET. (2022). Satellite Remote Sensing for Measuring Urban Heat Islands and Constructing Heat Vulnerability Indices. NASA Applied Remote Sensing Training Program (ARSET). Retrieved from https://appliedsciences.nasa.gov/get-involved/training/english/arset-satellite-remote-sensing-measuring-urban-heat-islands-and
Global Climate Observing System. (n.d.). Essential Climate Variables. Retrieved 04 04, 2025, from https://gcos.wmo.int/site/global-climate-observing-system-gcos/essential-climate-variables
Islam, S., Karipot, A., Bhawar, R., Sinha, P., Kedia, S., & Khare, M. (2024). Urban heat island efect in India: a review of current status, impact and mitigation strategies. Discover Cities. Retrieved from https://doi.org/10.1007/s44327-024-00033-3
Islam, S., Karipot, A., Bhawar, R., Sinha, P., Kedia, S., & Khare, M. (2024). Urban heat island effect in India: a review of current status, impact and mitigation strategies. Discover Cities, 1(34). Retrieved from https://doi.org/10.1007/s44327-024-00033-3
Kishore, P., Basha, G., Venkat Ratnam, M., AghaKouchak, A., Sun, Q., Velicogna, I., & Ouarda, T. (2022). Anthropogenic influence on the changing risk of heat waves over India. Scientific Reports, 12(3337). Retrieved from https://www.nature.com/articles/s41598-022-07373-3
Lodha. (2025, January 14). Discover How Palava Maintains Cooler Temperatures and Superior Air Quality. Retrieved from https://www.lodhagroup.com/palava-city/blog/sustainability/discover-how-palava-city-maintains-cooler-temperatures-and-superior-air-quality?publisher=Organic-GMB&campaign=Organic-Search&adgroup=Lodha-Sterling-GMB-PERF-web#:~:text=%E2%80%A2%20Enhanced%20Blu
Marando, F., Heris, M., Zulian, G., Udias Moinelo, A., Mentaschi, L., Chrysoulakis, N., . . . Maes, J. (2021). Urban heat island mitigation by green infrastructure in European Functional Urban Areas. Sustainable Cities and Society, 77. Retrieved from https://www.sciencedirect.com/science/article/pii/S2210670721008301?via%3Dihub
NASA Earth Observatory. (n.d.). Land Surface Temperature Anomaly & Land Surface Temperature. Retrieved 04 04, 2024, from https://earthobservatory.nasa.gov/global-maps/MOD_LSTAD_M/MOD_LSTD_M#:~:text=Land%20surface%20temperature%20is%20a,as%20measured%20by%20the%20Moderate
Pearce, F. (2018, March 7). Urban Heat: Can White Roofs Help Cool World’s Warming Cities? Retrieved from https://e360.yale.edu/features/urban-heat-can-white-roofs-help-cool-the-worlds-warming-cities#:~:text=Summers%20in%20the%20city%20can,to%20maintain%20our%20cool%20grows
Sharma, R., Pradhan, L., Kumari, M., & Bhattacharya, P. (2021). Assessing urban heat islands and thermal comfort in Noida City using geospatial technology. Urban Climate, 35. Retrieved from https://doi.org/10.1016/j.uclim.2020.100751
TERI. (2013). Sustainable Urban Development Minimizing Urban Heat Island Effect and Imperviousness Factor. Bangalore: The Energy Resources Institute. Retrieved from https://www.grihaindia.org/sustainable-urban
TERI. (2017). Final Report on Urban Planning Characteristics to Mitigate Climate Change in Context of Urban Heat Island Effect. Bangalore: The Energy and Resources Institute. Retrieved from https://www.teriin.org/sites/default/files/2018-03/urba-heat-island-effect-report.pdf
Yadav, A., & Singh, J. (2024). A Study on Urban Heat Island (UHI): Challenges and Opportunities for Mitigation. Current World Environment, 19(1). Retrieved from https://cwejournal.org/vol1no1/pa-study-on-urban-heat-island-uhi-challenges-and-opportunities-for-mitigationp#:~:text=Urban%20Heat%20Island%20,the%20effects%20of%20UHI%20in
You may also like
 Sustainability
 Sustainability
 Sustainability
Recent Blogs
 Homebuyers Handbook
Homebuyers Handbook
Homebuyers Handbook
Homebuyers Handbook
Homebuyers Handbook
