- Our Story
- Our Impact
-
Our Projects

Residential
Commercial

- Careers
 Enquire
 Call
Call
 chat
chat
 Search
From Consumers to Catalysts: How Commercial and Industrial Consumers can Drive India’s Renewable Energy Transition
By Tarun Garg - RMI India Foundation, Aun Abdullah - Lodha
April 18, 2025Acknowledgements:
Nuvodita Singh, Shilpi Sharma, Arjun Gupta - RMI
Table of Contents
1. Commercial And Industrial (C&I) Consumers Are Critical To India's Energy Transition Story
2. Cost Savings And Sustainability Benefits Of Renewable Energy (RE)
3. Best Practices For C&I Consumers Adopting RE
Appendix I: RE Procurement Pathways
1. Commercial and Industrial (C&I) consumers are critical to India’s energy transition story
As 2030 draws near, India is progressing towards its ambitious target of achieving 500 GW of non-fossil fuel capacity [1]. In 2023, the government unveiled a bidding target of 50 GW of renewable energy (RE) capacity annually from FY 2023-24 to FY 2027-28 to stay on track for this milestone [i]. Despite record auctions of more than 50 GW in FY 2024, meeting this capacity deployment target remains challenging. The country added 27 GW RE capacity in calendar year 2024, and is likely to add 30 GW RE capacity over 2025-26 [ii].
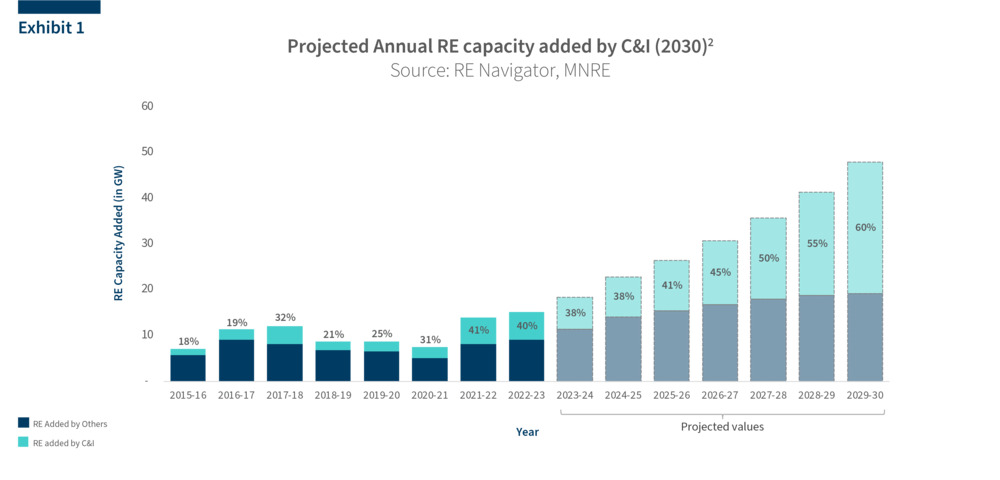
The commercial and industrial (C&I) electricity consumer segment has been a critical contributor to India’s RE capacity and could help bridge this capacity addition gap. Over the last decade, C&I consumers have constituted nearly half of India’s electricity demand. At the same time, it constitutes 18% of India’s total CO2 emissions as of 2022-23. C&I consumers have been rapidly deploying RE over the past decade, accounting for close to 40 % of all RE capacity as of 2022-23, up from about 20 % a decade ago. C&I consumers are projected to account for 60 % of all RE deployment in the country by 2030, highlighting their instrumentality in meeting annual deployment targets [iii] [1] (Exhibit 1).
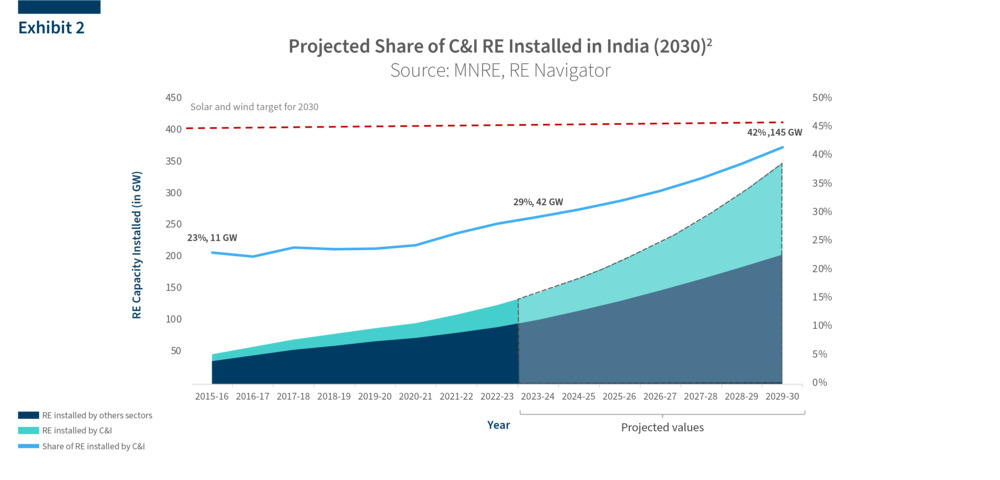
When viewed cumulatively, nearly 30% of India’s RE installed capacity till date can be attributed to the C&I consumer segment (Exhibit 2) [iv] [v]. By 2030, C&I consumers are likely to add over 100 GW of additional RE capacity that will be critical in helping achieve the combined solar and wind capacity targets [vi] [vii] [viii]. This also implies that C&I consumers alone could potentially account for nearly a third of India’s 500 GW target by 2030.
Nearly 70% of C&I’s total installed RE capacity is procured under the open access (OA) mechanism, with the rest coming from rooftop solar (RTS) deployment. When compared to other consumer categories (such as residential and agriculture), over 70% of the total RTS deployment in the country can be attributed to C&I consumers as of 2024 [ix].
In the next two sections, this report explores reasons why C&I RE procurement has significant growth potential and outlines critical factors that need to be considered by C&I consumers when creating an end-to-end RE procurement strategy to maximize electricity cost savings.
2. Cost savings and sustainability benefits of Renewable Energy (RE)
C&I consumers have a strong rationale for increasing RE penetration to meet their electricity needs, as they stand to benefit both on the economic and sustainability fronts. Various reasons for this include:
2.1. High electricity tariffs
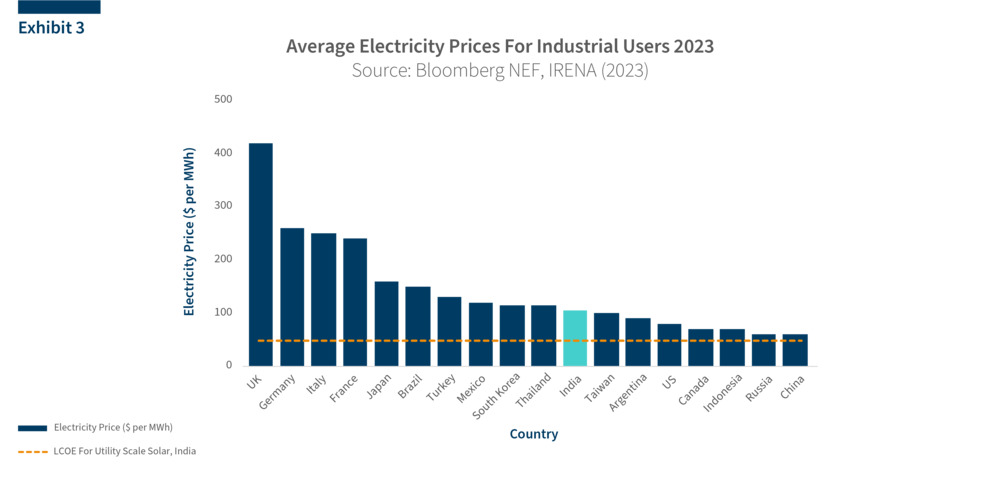
As evidenced by Exhibit 3, India’s industrial tariffs are substantially high when compared globally, surpassing USA, Indonesia and China. The imposition of cross subsidy by states to provide below-cost electricity supply to residential and agricultural sectors leads to higher electricity tariffs for C&I consumers in India.
Micro, small and medium enterprises (MSMEs), spend anywhere between 5-20% of their operational expenses on electricity costs [x]. Rising energy prices continue to put MSMEs at a competitive disadvantage compared to global peers. C&I consumers are increasingly driven towards RE owing to its plummeting costs as compared to rising electricity tariffs.
Open access procurement of RE is more cost-effective when compared to the grid even after accounting for open access charges in most states including Gujarat, Karnataka, Rajasthan and Tamil Nadu [xi]. In Maharashtra, RE procurement under Group Captive Open Access can yield savings of nearly 55% (Box 1).
Box 1: Potential savings for a typical commercial consumer in Maharashtra with Group Captive Open Access
For a typical commercial consumer in Maharashtra, the electricity tariff can be as high as ~Rs. 14 per unit [3]. However, significant amount of savings can be achieved by procuring electricity from group captive open access based RE assets.
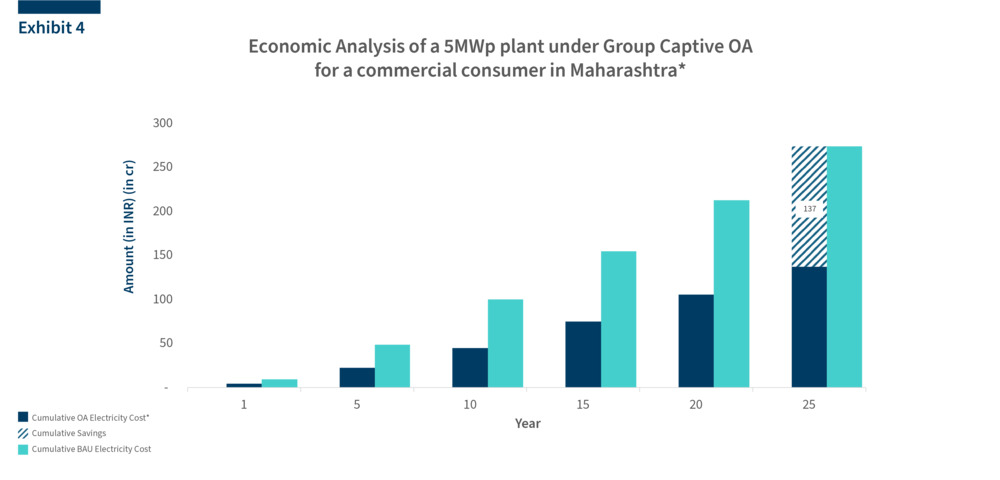
Exhibit 4 shows a comparison between the electricity bill based on grid tariff and the electricity bill from a 5 MW plant via the group captive open access pathway for a commercial consumer in Maharashtra [4]. With the landed tariff of electricity from the 5 MW plant as low as ~Rs. 6.5 per unit, the difference of ~Rs. 7 per unit in grid tariff and PPA tariff leads to bill savings of over Rs. 4 cr. in the first year alone [5]. The annual savings from this procurement are projected to increase year-on-year and reach a cumulative lifetime savings of nearly Rs 140 crores by the 25th year, demonstrating the long-term financial benefits of procuring RE through open access in Maharashtra.
2.2. Growing sustainability initiatives
Growing sustainability initiatives adopted by C&I consumers are contributing to RE demand
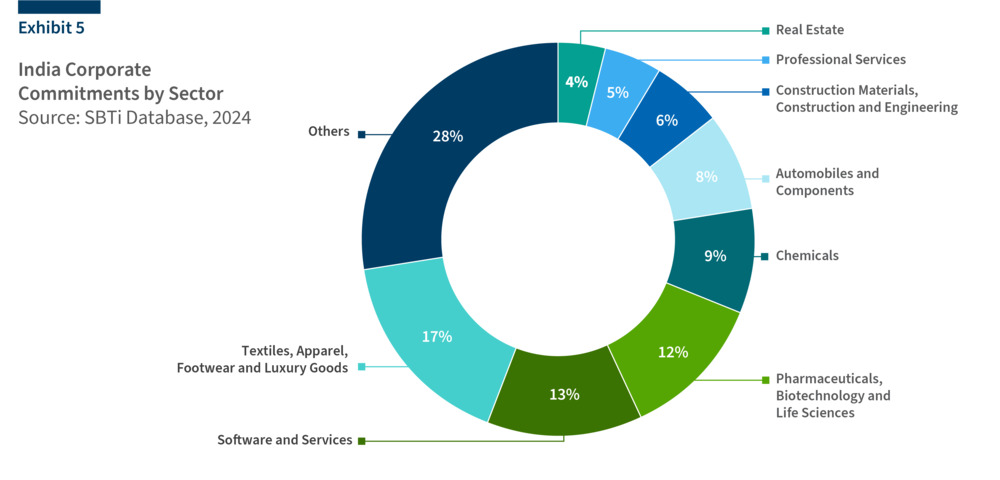
Procuring RE to meet electricity is one of the most used levers for decarbonization. For instance, in 2024, over 200 Indian companies were a part of the global Science Based Targets initiative (SBTi), which enables organizations to set emissions reduction targets through tools and guidance (Exhibit 5) [xii]. This includes procuring RE-based electricity.
15 Indian companies are a part of the global RE100 initiative wherein members commit to consume 100% renewable electricity by a target year [xiii]. In 2022, India was the second largest market for RE procurement contracts.
2.3. Evolving global carbon pricing frameworks:
CBAM (Carbon Border Adjustment Mechanism) which is likely the world’s first carbon border tax will enter into force on 1st January 2026. It is a quest for greening energy imports to the region and balance carbon pricing norms for imported goods and domestically produced goods in the EU (which are subjected to the Emissions Trading System (ETS)) [xiv].
The mechanism will initially cover carbon intensive sectors such as cement, iron and steel, aluminium, fertilisers, electricity, hydrogen [xv]. Companies in India are rushing to secure RE deals to avoid penalties imposed on net carbon emissions under CBAM [xvi]. As a result of the above developments, demand for RE by C&I consumers has outstripped supply by approximately 10 GW this year (2024) [xvii].
India has also launched its own carbon credit trading scheme (CCTS) which is likely to be implemented in 2026, to support its nationally determined contributions (NDC) goal of achieving 45% reduction in emissions intensity based on 2005 levels by 2030 [xviii]. Participating in this system will further add pressure on C&I consumers to decarbonize and reduce emissions to attract lower CBAM charges in the future.
3. Best Practices for C&I Consumers Adopting RE
- Due to reasons discussed above, - C&I consumers have the maximum upside for adopting RE when compared to other consumer classes. But despite the lucrative benefits, only 9% of C&I electricity demand is met by RE resources as of 2022-23.
- Identifying the ideal procurement strategy based on state regulations and user needs (internal targets, space availability, demand profile and financing needs) and a credible RE developer to meet those needs remain challenging for consumers preventing rapid adoption. Rising duties, surcharges and banking restrictions further impact the economic feasibility of RE procurement.
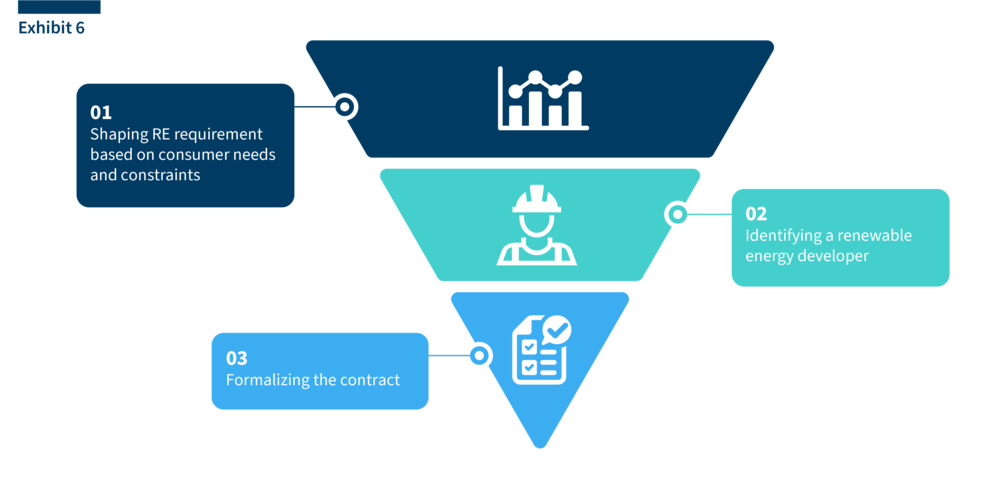
- This section highlights best practices and showcases critical decision-making variables for C&I consumers across the different stages of executing an RE procurement strategy (Exhibit 6).
3.1. Shaping RE Requirements Based on Consumer Needs & Constraints
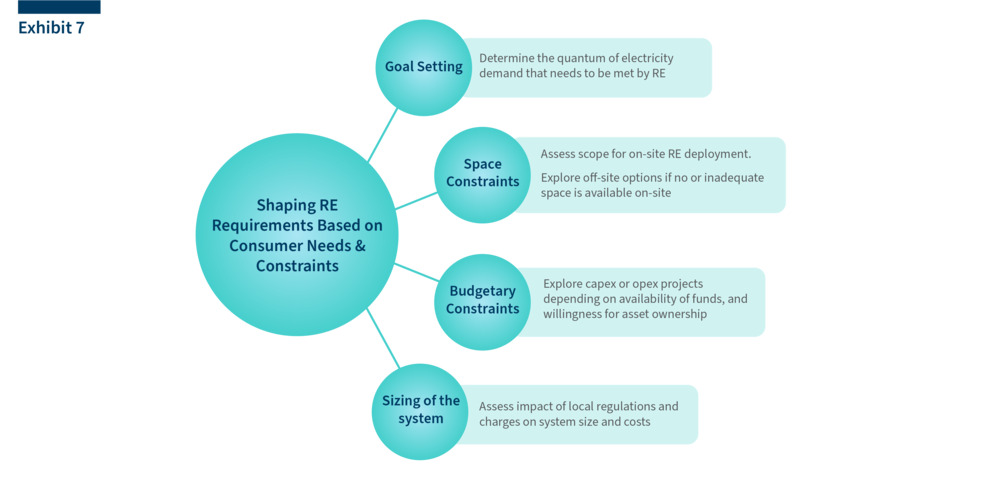
3.1.1. Defining organisation goals:
Organizations can tailor their RE requirements to meet specific goals, such as
- Sustainability commitments: achieving 100% of their electricity demand through renewable sources or achieving net-zero by a certain year;
- Regulatory compliance:designated entities in India need to follow renewable purchase obligations (RPO) as defined by the Ministry of Power (MoP);
- Cost savings: C&I can benefit from low cost RE to meet its electricity needs.
Accordingly, the organization can set a quantum of electricity demand that needs to be met by RE
3.1.2. Technical and Economic Assessment
a. Space Constraints
As on-site RE systems (mostly rooftop solar via net-metering) are the most lucrative RE pathway, C&I consumers can start their assessment by evaluating the roof or ground space available at their premises for potential RE deployment. Typically, large consumers of electricity with limited accessible roof/ground space can only meet a fraction of their electricity demand with on-site renewable energy pathways, driving them towards off-site pathways.
Among an array of off-site procurement options, open access offers attractive economic benefits as consumers can meet their demand with RE plants located outside their premises (but typically within the State premises). They offer consumers the advantage of scale wherein a consumer can meet 100% of their needs via RE. At the same time, off-site pathways invite greater regulatory complexity and attract additional charges including wheeling, transmission, duties, additional surcharge and cross-subsidy surcharge which impacts the economic feasibility of pathways.
Box 2: Integrating on-site and off-site RE procurement options
To maximize their savings, consumers can optimize RE procurement by strategically combining on-site and off-site generation. State-specific regulations permitting consumers to adopt net-metering and open access must be in place for this strategy. Consumers should begin by estimating the average monthly electricity consumption to determine the equivalent RE capacity required. Next, on-site system size can be estimated based on the available shade-free roof or ground space.
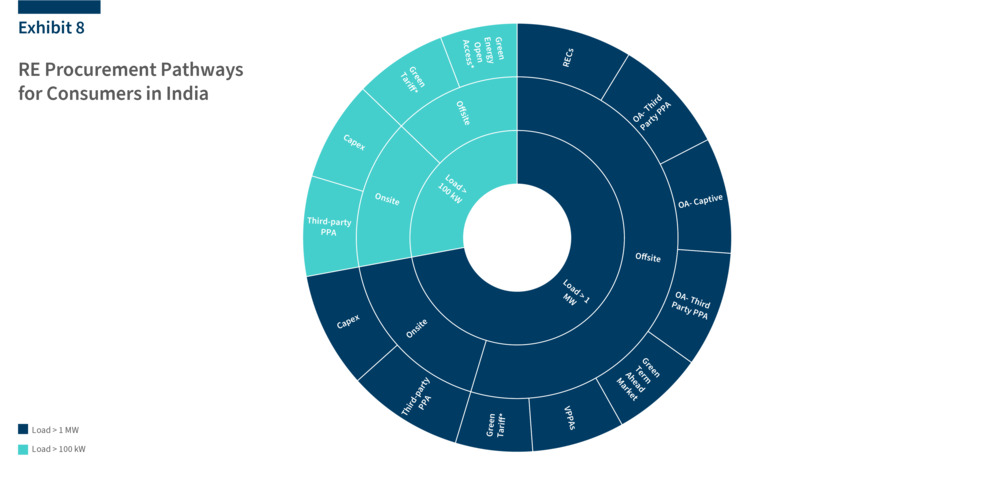
Any outstanding demand can be met through off-site RE procurement options. For larger consumers with sanctioned load exceeding 1 MW, Open Access (OA) pathways can provide a viable solution, while Green Energy Open Access (GEOA) is ideal for those with a sanctioned load greater than 100 kW. This integrated approach allows consumers to fully utilize available on-site space to meet their RE requirements while maximizing savings. Exhibit 8 showcases the array of onsite and offsite RE procurement pathways for C&I consumers in India
b. Budgetary constraints
A consumer must identify the equity they can invest in the RE assets. Consumers that can afford partial or complete upfront costs of the project can adopt captive on-site or off-site RE pathways. These pathways offer some of the highest savings and very short payback periods relative to alternate pathways. However, consumers with cash constraints or a preference to remain asset light, can opt for third-party or RESCO models which allows them to pay a pre-determined tariff for the electricity offered by RE developers over a fixed tenure of 10-25 years. The project economics vary significantly based on the equity infusion and pathway that a consumer adopts (Box 3).
Box 3: Comparison of project economics for a typical commercial consumer in Maharashtra
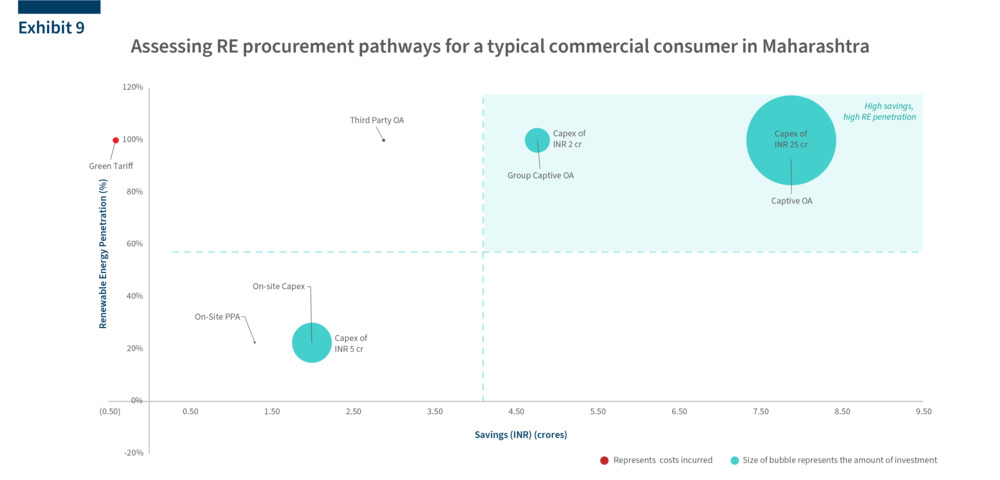
A critical takeaway from Exhibit 9 is that savings potential exists across a majority of RE pathways (except green tariffs) highlighting the tremendous opportunity that consumers can leverage by adopting RE. It indicates the impact of critical decision-making variables like consumer equity investment, on-site space availability and organisation targets on the procurement pathways which determines the overall economic savings for consumers. For instance, while onsite PPA requires no upfront investment from the consumer, the savings as well as RE penetration are limited by the space availability and hence, project size. Group Captive OA on the other hand, requires upfront investment, but has the most benefits in terms of potential for savings and RE penetration.
c. System Design Considerations
Matching RE generation with current and anticipated future demand of the consumer determines the quantum of RE generation needed which can impact equity investments, tariffs and economic savings offered by RE developers. System design parameters must take into account existing regulatory constraints at a state level to determine project economics. For instance, Uttar Pradesh permits net billing for C&I consumers installing rooftop solar projects, Maharashtra restricts open access project capacity to 140% of a consumer’s sanctioned load.
With stringent banking regulations and rising banking and open access charges for off-site projects across several states, a deeper dive into the hourly balancing of demand and supply from RE assets is recommended to account for losses due to transmission, wheeling and banking (Exhibit 10). Consumers with higher electricity demand during non-solar hours can evaluate wind based RE procurement or couple battery storage with their RE assets.
Box 4: Impact of Banking regulations on project size
Banking regulations enable consumers to ‘bank’ any surplus energy production with the grid and withdraw later for utilisation when RE production is lower than consumption needs. While regulations such as banking promote RE adoption by enabling the consumer to benefit from low-cost electricity production over a longer duration, they are accompanied by banking charge that can affect project economics and project size.
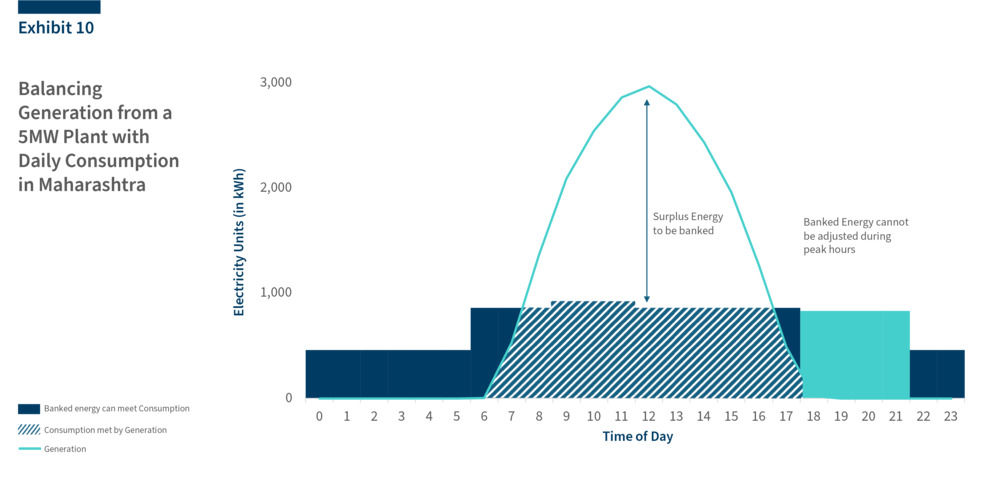
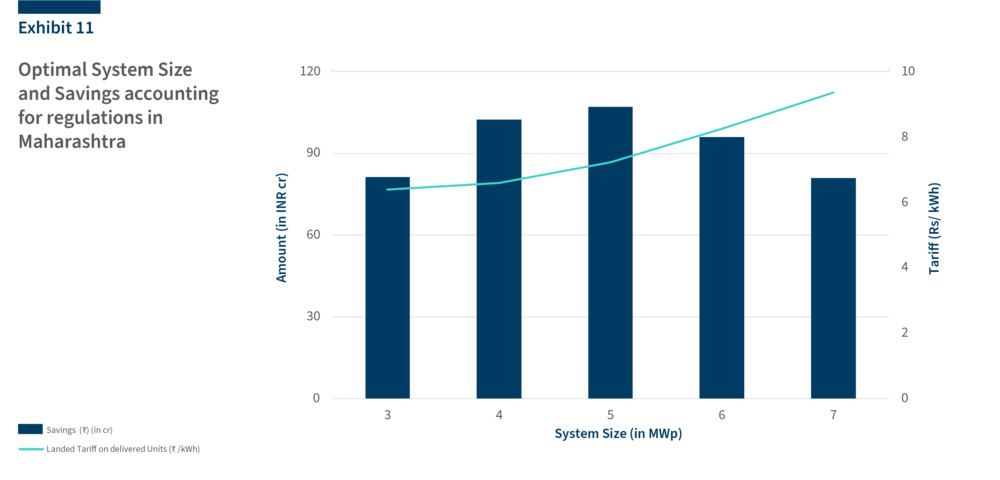
Exhibit 10 showcases how banking plays out on a daily basis. The 5MW solar plant produces surplus energy in the middle of the day that can be banked and utilised to cover consumption in off peak non-solar hours during the day and night. Given a specific quantum of electricity consumption, an undersized project may not meet demand adequately, while an oversized project can lead to excess generation and excess banking losses (either in electricity units or rupee terms). Exhibit 11 indicates where savings from RE procurement to meet the consumer’s consumption peaks at a project size of 5 MW, after which the savings decline.
Notably, any unused banked electricity lapses at the end of a stipulated banking cycle. While annual banking cycle provide maximum benefits to consumers, some states such as Maharashtra and Gujarat have converted to monthly banking facilities, and others such as Andhra Pradesh and Karnataka have withdrawn this provision completely.
Therefore, in addition to matching monthly or annual electricity consumption needs with RE generation, consumers may also consider understanding daily consumption and RE generation patterns, as well as local regulations to determine the right project size.
3.2. Identifying a Renewable Energy Developer
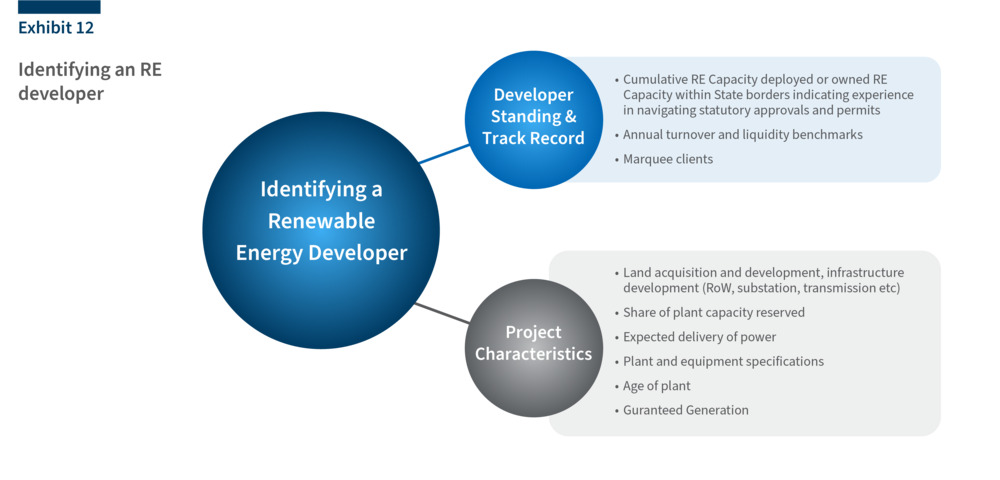
As RE assets have an operational life of 20-25 years, identifying the right RE developer is critical to ensure sustained performance of the assets over their lifetime. With growing demand for RE, the number of developers and their products are rising across India. However, identifying developers that align with the consumer’s requirements indicated in the previous section is vital. Exhibit 12 highlights the top decision variables that consumers can consider while identifying the right developer.
- Developer Standing and Track Record: The track record of a developer can be measured via the total RE capacity deployed till date and the marquee clients they have catered to. Given the complexity of navigating State regulations and permitting for RE projects (especially for Open Access), successful and time-bound execution of previous projects within State boundaries should be considered. The developer’s financial standing can be assessed via their annual turnover and presence of reputed domestic or foreign partners.
- Project Specifications (applicable for Open Access):For consumers opting for open access projects, project specification can determine economic savings potential over the asset lifetime and must be carefully assessed. While analysing greenfield projects, the status of infrastructure development parameters including land acquisition, securing right of way (RoW) and transmission and substation clearances can determine project readiness. A shorter lead time for the expected delivery of power and guaranteed RE generation by the developer ensures maximum economic benefits from the RE asset in the shortest time frame for consumers.
For open access projects, the share of plant capacity already reserved (preferably by marquee clients) can bolster the confidence of consumers in the developer and the project. Consumers assessing projects that are already in operation are recommended to understand the age of the plant as older plants could face lower asset performance (as compared to new assets) and incur electricity duties. (Ex: Maharashtra imposes electricity duty on RE plants after 10 years).
For consumers anticipating higher electricity demand in the future from the same site, it is recommended to consult with developers if additional RE capacity can be assigned for future demand (assuming state regulations permit multiple RE assets for the same site). Given the multiple criteria that consumers need to consider when identifying the developer, developing detailed bid documents and inviting multiple developers to participate for bidding can help identify the ideal developer.
3.3. Formalizing contract with selected developer

The effective performance and the economic savings of RE assets over their lifetime can be dictated by specific contractual obligations offered by developers. But as these contracts typically include a wide-ranging set of terms including but not limited to equity and tariff details (for RESCO projects), power delivery, operational, and risk mitigation terms (for both developer and consumer), they are often comprehensive and can be challenging for consumers to navigate. Some of these key contractual terms that consumers must assess and negotiate are:
- Base Tariff and project term (For RESCO) - The base tariff is the per unit electricity cost that the developer offers for the delivery of power from the RE asset. The term of the project is typically fixed for a period of 10 – 25 years based on the consumer’s preference. Tariffs are typically fixed over the lifetime of the project but can have an escalator based on the developer and consumer’s preference. Developers typically include a lock-in period in the contract with specific penalties for consumers who breach the contract within the lock-in period.
- Performance Guarantees – Developers typically offer a minimum annual generation guarantee within the contract, failing which they are liable to offer compensation for the shortfall in generation. These terms coupled with the base tariff provide clarity on the savings a consumer can accrue over the project lifetime. Developers also offer minimum savings guarantees across the project lifetime which can help determine the minimum savings expected.
- Green Credits– Typically the consumer is obligated to receive the green credits for the projects they sign up for based on the generation from the plant. This should typically be included in the base tariff offered by the developer. It is recommended for consumers to clarify these terms during the contract negotiation window.
- Other items– Discussing and understanding terms such as ‘Liquidated damages’ (due to delays in project commissioning) and ‘force majeure’ (unforeseen events such as natural disasters and plant failure that affect contract terms can help insulate consumers and developers from unanticipated consequences. Payment terms and bank guarantee requirements for RE assets must be closely reviewed and are typically tied to project milestones. Consumers who may witness a change in demand during the project lifetime can also negotiate specific terms with the developer to update project capacity to ensure maximum savings throughout the project lifetime.
4. Conclusion
Having surpassed the 200 GW installed RE capacity milestone in 2024, India is firmly on the path of its energy transition. C&I consumers will play a pivotal role in accelerating India’s energy transition this decade as this sector alone has the potential to account for nearly 30% of RE needed for India to meet its ambitious 2030 target of 500 GW of non-fossil fuel energy. In an evolving global economic and climate landscape, RE procurement by C&I consumers is not just an environmental imperative but also a strategic opportunity to enhance global competitiveness. By reducing energy costs and preparing for evolving trade mechanisms like the EU's Carbon Border Adjustment Mechanism (CBAM) or India’s Carbon Credit Trading Scheme (CCTS), businesses can future proof their operations and stay ahead of regulatory and market trends.
This report highlights the cost-saving opportunities available to C&I consumers across various RE procurement pathways. It simplifies the process, offering guidance on critical considerations such as regulatory feasibility, project sizing, developer selection, and contractual frameworks, to empower businesses to make informed decisions. Scaling up RE adoption by C&I consumers will not only bolster the country’s progress toward its 2030 climate goals but also strengthen India’s position as a global leader in sustainable energy solutions.
Appendix I: RE Procurement Pathways
Table 1: Long-term RE procurement models
| Definition |
|---|---|
| On-site | |
| Capex | The capital expenditure model is a self-funding model wherein consumers bear the complete capital expenditure incurred in installing the RE generator (typically an RTS system) upfront. These expenses include the equipment cost, labour, upgrades and other material costs. Future maintenance and any operational costs are also borne by the consumer [xix]. |
| A third-party on-site PPA is a contractual agreement between a consumer who owns the premises and an RE developer who owns the RE asset and provides the sale of electricity from the asset for 10–25 years. The asset is usually fixed on the consumer’s premises for the entire duration of the PPA. No upfront capital investment required by consumer. | |
| Off-site | |
| Third-party PPA via OA | OA allows consumers with connected load greater than 1MW to choose their own electricity supplier. OA consumers can sign third-party PPAs for RE assets beyond their premises either within or outside the state [xx] [xxi]. No upfront capital investment required by consumer. Consumer can meet 100% of their electricity demand with RE, as the asset is off-site and has no space constraints. |
| Captive/ Group Captive via OA | A captive generation plant in India may be set up by any person, co-operative society or association of persons (including companies) for generating electricity primarily for self-consumption. Multiple stakeholders can subscribe to a captive power plant through a group captive mechanism involving setting up a power plant and buying at least 51% of the generated electricity, with a minimum 26% ownership and a 10% allowable variation in consumption based on ownership shares [xxii]. |
| Green Energy OA (GEOA) | GEOA grants consumers and businesses with connected load greater than 100kW, unrestricted access to multiple RE sources by enabling consumers to choose electricity suppliers based on preferred renewable sources (e.g. solar, wind, hydro, biomass). Consumer can meet their 100% demand with RE, as the asset is off-site and has no space constraints. |
| Community Solar | Community solar allows a group of consumers to own a common RE asset usually deployed on an off-site location. Consumers receive net-metering benefits from the common asset proportional to their ownership of the RE asset directly on their electricity bills. The model enables consumers with limited or no roof access to adopt RE [xxiii]. |
| Virtual Power Purchase Agreements (VPPAs) via Bilateral Transaction | VPPA is a bilateral agreement signed between the power producer (RE generator) and the C&I consumer without any physical delivery of power. Under VPPA, the power producer sells its electricity on the power exchange (such as IEX and PXIL) at the market price. The consumer only receives the RE attribute (green energy credits) associated with the traded power for a pre-agreed VPPA contract price called the strike price. However, the difference between the strike price and the wholesale market rate forms the basis of the actual price settlement between the consumer and power producer [xxiv]. |
Table 2: Short-term RE procurement models
| Models | Definition |
|---|---|
| Green Tariff | Green tariff is a specialised retail tariff that electricity Discoms charge for the sale of RE to consumers. Consumers can sign up for this tariff from Discoms procuring electricity on their behalf from RE plants [xxv]. |
| Green Term-Ahead Market (GTAM) | Green term-ahead market (GTAM), a power trading platform, was launched to enable bulk electricity buyers (C&I consumers with a contracted load of 1MW or above) to procure RE on a short-term basis from merchant RE projects or Discoms having surplus RE beyond their renewable purchase obligations or RPOs through bilateral trading. It also created opportunities for project developers to develop merchant RE capacity without getting tied down by long-term PPAs. Four types of short-term contracts are covered under the GTAM: intra-day, day-ahead contingency, daily and weekly [xxvi]. |
| Renewable Energy Certificates (RECs) | RECs are market-based instruments that promote RE sources and the electricity market. Each REC represents 1MWh of electricity generated from renewable sources such as solar and wind. RECs track and verify the flow of green energy into the power grid. They are also referred to as green tags, tradable renewable certificates (TRCs), RECs or RE credits. Buyers and sellers of RECs include RE generators, utilities and individuals. The trading mechanism occurs in energy markets, where buyers purchase RECs to meet RE targets or demonstrate their commitment to sustainability, while sellers offer RECs based on their RE production. |
| P2P Trading | The P2P model creates an online marketplace where prosumers and consumers can trade electricity without an intermediary at a mutually agreed price [6] [xxvii]. This model is primarily deployed within the same Discom jurisdiction via localised energy trading platforms [xxvii]. |
Footnotes
[1] Including large hydropower
[2] Excluding large hydropower
[3] Through the report, we present techno-economic analysis based on a hypothetical example of procurement from a 5MWp system under group captive open access in Maharashtra. The annual consumption is assumed to be 6.2 million units (MUs), with an average of 0.52 MUs per month.
[4] Annual generation is assumed as 15,50,000 units per MWp. The electricity tariff is assumed to increase at 2% every year. Electricity Bill as per open access (OA) PPA also includes Regulatory charges, Electricity Duty and cost of equity return of capital. Procuring electricity through the group captive open access route attracts transmission, wheeling and banking losses and additional charges such as transmission and wheeling charges, in addition to the per unit PPA tariff. Additional Surcharge (AS) and cross subsidy surcharge (CSS) are not applicable in the group captive open access route.
[5] In Maharashtra, electricity duty of 21% is imposed on the electricity procured from open access after year10
[6] A prosumer is a consumer who also produces electricity mostly through on-site resources such as RTS systems.
References
[i] Press Information Bureau. “Cabinet Approves Rooftop Solar Programme Phase-II.” Government of India. https://pib.gov.in/PressReleaseIframePage.aspx?PRID=1913789.
[ii] Financial Express. “Industry: India to Add 30 GW RE Capacity in 2 Years to FY26.” https://www.financialexpress.com/business/industry-india-to-add-30-gw-re-capacity-in-2-years-to-fy26-3705987/.
[iii] India RE Navigator. https://india-re-navigator.com/.
[iv] India RE Navigator. https://india-re-navigator.com/.
[v] Ministry of New and Renewable Energy (MNRE). “Year-wise Achievement.” https://mnre.gov.in/year-wise-achievement/.
[vi] India RE Navigator. https://india-re-navigator.com/.
[vii] Ministry of New and Renewable Energy (MNRE). “Year-wise Achievement.” https://mnre.gov.in/year-wise-achievement/.
[viii] Central Electricity Authority. Report on Optimal Generation Capacity Mix for 2029–30 Version 2.0. May 2023. https://cea.nic.in/wp-content/uploads/irp/2023/05/Optimal_mix_report__2029_30_Version_2.0__For_Uploading.pdf.
[ix] India RE Navigator. https://india-re-navigator.com/.
[x] Observer Research Foundation. “Prioritising MSMEs in India’s Policy Push for Rooftop Solar.” https://www.orfonline.org/expert-speak/prioritising-msmes-in-india-s-policy-push-for-rooftop-solar
[xi] ICRA. India Renewable Energy Sector - C&I Market Outlook.
[xii] Science Based Targets initiative. “Companies Taking Action.” https://sciencebasedtargets.org/companies-taking-action#dashboard.
[xiii] RE100. “Technical Guidance.” https://www.there100.org/technical-guidance.
[xiv] Ernst & Young. “Green Energy Trade Shift: Implications of the New EU CBAM Norms.” https://www.ey.com/en_in/insights/tax/green-energy-trade-shift-implications-of-the-new-eu-cbam-norms.
[xv] Ernst & Young. “Green Energy Trade Shift: Implications of the New EU CBAM Norms.” https://www.ey.com/en_in/insights/tax/green-energy-trade-shift-implications-of-the-new-eu-cbam-norms.
[xvi] Mint. “Europe’s Carbon Tax (CBAM) Sparks a Race for Renewable Energy in India.” https://www.livemint.com/economy/europe-carbon-tax-cbam-race-for-renewable-energy-india-sustainability-11725189118532.html.
[xviii] Ernst & Young. “Green Energy Trade Shift: Implications of the New EU CBAM Norms.” https://www.ey.com/en_in/insights/tax/green-energy-trade-shift-implications-of-the-new-eu-cbam-norms.
[xix] Nithin Thomas Pramod, “CAPEX or OPEX – Ways to Finance Rooftop Solar Systems and Realize Huge Savings,” Mercom, last modified November 26, 2020, https://www.mercomindia.com/capex-opex-finance-rooftop-solar.
[xx] “Understand Third-Party PPA Structures,” Clean Power Hub, accessed June 30, 2023, https://www.cleanpowerhub.net/invest-in-or-develop-clean-power/-crp/141218.
[xxi] “Third Party (Open Access),” Suryamitra Renewables, accessed June 30, 2023, https://suryamitra.co.in/solar-farma8f2.html?product=Third-Party-(Open-Access)#:~:text=Third%20party%20Open%20Access%20is,3rd%20party%20supplier%20of%20power.
[xxii] “Electricity Rules, 2005,” Ministry of Power, Government of India, accessed June 23, 2023, https://cea.nic.in/wp-content/uploads/legal_affairs/2020/09/Electricity-rules-2005.pdf.
[xxiii] “What Is Virtual Net Metering?,” Ontario Solar Installers, accessed June 30, 2023, https://ontario-solar-installers.ca/solar-panel-installers/what-is-virtual-net-metering/.
[xxiv] “Simplifying Virtual Power Purchase Agreements (VPPA)- Indian Perspective,” JMK Research &Analytics, last modified November 9, 2022, https://jmkresearch.com/simplifying-virtual-power-purchase-agreements-vppa-indian-perspective/.
[xxv] “Options for Indian Corporates To Go Green,” Centre For Energy Finance, accessed June 30, 2023, https://www.ceew.in/cef/masterclass/explains/options-for-indian-corporates-to-go-green.
[xxvi] “Green Term–Ahead Market,” Centre for Energy Finance, accessed June 30, 2023, https://www.ceew.in/cef/masterclass/explains/d5ee2888-9978-42fc-b482-b2d9c19a6cff.
[xxvii] Consumer vs Prosumer: What's the Difference?,” Office of Energy Efficiency & Renewable Energy, last modified May 11, 2017, https://www.energy.gov/eere/articles/consumer-vs-prosumer-whats-difference.
[xxviii] “Peer-To-Peer Electricity Trading Innovation Landscape Brief,” International Renewable Energy Agency, accessed June 30, 2023, https://www.irena.org/-/media/Files/IRENA/Agency/Publication/2020/Jul/IRENA_Peer-to-peer_electricity_trading_2020.pdf?la=en&hash=AB7E0CFED5A51CFD75EB2CC1FB635B64329BB439.